I’ve written about tech debt and how often it’s used as a catch-all term for a range of issues, often no one can say how much debt exists or what the cost of it is. This results in vague discussions and a lack of paying down the debt.
I’ve also covered engineering toil that quiet, repetitive work that slows teams down and chips away at morale, yet rarely gets counted in any official budget or roadmap.
This post introduces liability mapping: a framework for improving tech debt conversations and helping teams prioritise what to fix and when. Instead of endless debates about “debt” and “toil”, you can focus on what actually needs attention.
What is liability mapping?
Liability mapping breaks “tech debt” into five categories, separating minor annoyances from real risks. Each category gets a clear owner and action:
| Category | Definition | Primary signal | Typical owner action |
|---|---|---|---|
| Liability | Clear, externally-visible risk that violates contractual, security, or compliance obligations. | CVE backlog, failed audits. | Must-fix inside cycle time or sprint. |
| Drag | Internal friction that slows feature flow but rarely harms customers directly. | Build times, flaky tests, manual deploy steps. | Schedule & track via flow-metrics budget. |
| Hazard | Latent defect with low frequency but high blast-radius. | Single-point-of-failure, critical data coupling. | Invest in redundancy or feature-flags before feature work. |
| Relic | Dormant code, unused infra, forgotten toggles that clutter cognition. | Zero-call endpoints, abandoned feature flags. | Archive or delete quarterly; measure LOC shrink. |
| Bet | Conscious shortcut taken for speed-to-market with a written expiry date. | TODO markers with “sunset-by” field; prototype branches. | Review in risk council before expiry; promote or retire. |
Each category represents different pain: customer harm (liability, hazard), team velocity (drag), cognitive load (relic), and calculated risk (bet). Call them all “tech debt” and everything becomes equally urgent or equally ignored.
Once you see which problems fall into which bucket, conversations about what to fix now, what to plan for, and what you can safely ignore become much clearer.
Creating your first liability map
Start with evidence, not opinions. Pull from security scans, incident reviews, flow metrics, dead-code analysis. You want facts that everyone can see and agree on.
Bring together engineering, product, and compliance if needed. Run a quick workshop: take each item, debate its category, assign one of the five classes. Don’t overthink edge cases argue once, decide, move on. You’re classifying what something is, not how it happened.
After labelling, add rough triage scores. Ask: Does this hurt customers now? Could it explode later? How much does it slow us down? Do we actually understand it? You’re gauging immediacy, blast radius, and confidence level.
Now, with everything tagged and scored, it’s time to make the map.
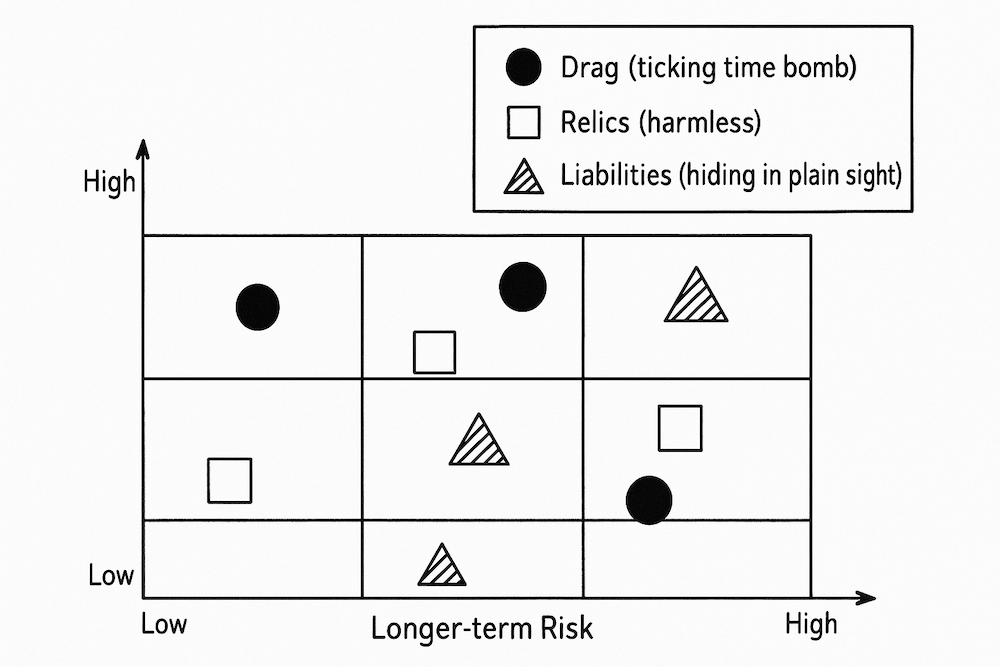
I like to plot items on a 3x3 grid: immediate impact versus long-term risk. Colour-code by class. Instantly, certain problems will stand out, the “drag” that’s actually a ticking time bomb, the relics that are harmless, the liabilities hiding in plain sight. This picture gives everyone a shared, visual sense of what really needs urgent attention and what can stay in the backlog for now.
Connect the map to how you actually budget and prioritise work. Anything labelled a liability or hazard goes into the run-cost or operational budget those are the items that could hit you with fines, customer churn, or outages if left unchecked. Drags, relics, and bets get slotted into your change-cost or innovation work streams.
This translation helps when you’re trying to get buy-in from finance or leadership, because it connects technical pain to business costs and value.
The map is a living document, not a one-time exercise. Your first attempt will be rough that’s fine. Start somewhere. Over time, you’ll get better at spotting liabilities early and pruning relics before they pile up.
Getting exec buy-in
Executives care about risk, money, and time not “refactoring” in the abstract. They want to know why they should fund work that isn’t features or revenue. Connect every liability to avoided disasters, faster delivery, or cost reduction.
-
“Why refactor now?” Point to liability-class issues. Show the legal exposure or headline risk. Patching the roof is less expensive than fixing flood damage. You’re protecting the business, not just cleaning code.
-
“Isn’t this nice to have?” Show data. Cutting drag led to features shipping 30% faster. Cost per change dropped. Churn decreased. Technical clean-up that boosts throughput isn’t nice to have it makes money.
-
“We can’t pause the roadmap.” The map shows why 15% capacity on clean-up compounds over time: less firefighting, predictable launches, declining run-costs. You’re not pausing the roadmap you’re clearing the path.
Liability mapping gives you a credible story you can act on. You can meet execs where they are, with real numbers and outcomes, instead of hand-waving about invisible debt. The conversation shifts from begging for resources to shared understanding: fix the right things, at the right time, and the business moves faster and safer.
Creating an example map
Consider SportingGoods, an e-commerce company. Their payment system critical to the business has accumulated shortcuts and legacy infrastructure. Engineers struggle to ship changes. Product worries about outages hitting revenue.
| Class | Example | Action |
|---|---|---|
| Liability | Payment service is still handling card data using a deprecated PCI flow, immediate upgrade required to avoid fines. | Patch and migrate to current PCI-compliant flow now. |
| Drag | Deployments to the payment service can only happen during a two-hour maintenance window, causing week-long lead times. | Invest in zero-downtime deploys and automation. |
| Hazard | All payment requests are routed through a single, unmonitored queue, one silent failure could block every transaction. | Add monitoring and redundancy before peak season. |
| Relic | Codebase still contains endpoints for a retired payment partner (SportPay), unused for nine months, but never cleaned up. | Identify, archive, and safely delete old endpoints. |
| Bet | Fast-tracked “Buy Now, Pay Later” feature shipped behind a toggle, with no refund logic, review before next quarter. | Reassess, build missing logic or sunset as needed. |
This one-page map turns technical complaints into a shared plan. What to do next and how urgent it is becomes obvious.
Keeping the map up to date
Once you’ve got liability mapping up and running, the next challenge is making sure it stays up to date. Any system like this, left unchecked, starts to drift, labels blur, maps go stale, and before long, people slip back into calling everything “debt”. The real work is keeping your categories clear and the map relevant.
-
Be ruthless with labels. One item, one class whichever needs fixing first. If something straddles drag and hazard, pick one. This discipline ensures you know what to tackle first, not hedge with dual priorities.
-
Labels expire. Set a twelve-month limit entries disappear unless actively renewed. This keeps the map current, not an archive of old worries.
-
Store the map with your architecture decision records in the repo engineers use daily. Transparency prevents opinion based debt arguments and builds shared understanding.
Keeping the map honest isn’t about more process, it’s about small, consistent acts of clarity: pick a label, expire old entries, and keep the map where everyone can see it. This ensures the liability map stays useful, not just another forgotten spreadsheet.
Published on .